2

I'm testing my network infrastructure where I'm using iPerf and UDP protocol.

I'm using the following:

On the server side:

ubuntu@ip-172-0-1-11:~$ iperf -s -u

and the client side:

ubuntu@ip-172-2-1-10:~$iperf -c 172.0.1.11 -u -b 100m 

I understand that when more traffic than a link can handle is sent to a link, the interface to that link will end up dropping the packets destined for that link. However, I'm interested in collecting those packet loss rates. Is there a way to collect it?

I'm running Cacti an open-source, web-based network monitoring and graphing. SNMP server is enabled in the Cisco routers.

Router(config)#snmp-server community public RO 
Router(config)#snmp-server community private RW

I'm getting the collected data of the interfaces in the Cacti server. However, I want also to have packet loss data collected, too.

Edited part of the question

I added the In/Out Errors/Discarded Packets to the graphs' tree in Cacti. However, so far there is no data which is collected, it is always 0, and I can see from Iperf that there is packets loss, although there are data and graphs for the In/Out Bits graphs.

This the information I got from the interface:

{
"Cisco-IOS-XE-interfaces-oper:statistics": {
    "discontinuity-time": "2019-06-26T15:09:55.000005+00:00",
    "in-octets": "4140080366",
    "in-unicast-pkts": "5381499",
    "in-broadcast-pkts": "0",
    "in-multicast-pkts": "0",
    "in-discards": 0,
    "in-errors": 0,
    "in-unknown-protos": 0,
    "out-octets": 2579777476,
    "out-unicast-pkts": "13916798",
    "out-broadcast-pkts": "0",
    "out-multicast-pkts": "0",
    "out-discards": "2843",
    "out-errors": "0",
    "rx-pps": "5527",
    "rx-kbps": "34266",
    "tx-pps": "16523",
    "tx-kbps": "106588",
    "num-flaps": "0",
    "in-crc-errors": "0"
}

}

Apparently, there's no packet loss recorded in in-errors and out-errors which are both 0. However, sometimes I got packet loss from the Iperf report:

[  5] local 172.2.1.10 port 5001 connected with 172.0.1.11 port 43372
[  5]  0.0-842.3 sec  23.8 MBytes   237 Kbits/sec   0.250 ms    2/17008 (0.012%)
[  4] local 172.2.1.10 port 5001 connected with 172.0.1.11 port 43961
[  4]  0.0-857.3 sec  23.8 MBytes   233 Kbits/sec   0.548 ms    9/17008 (0.053%)
[  5] local 172.2.1.10 port 5001 connected with 172.0.1.11 port 51505
[  5]  0.0-872.4 sec  23.8 MBytes   229 Kbits/sec   0.260 ms    0/17008 (0%)

I really don't understand the reason for this packet loss.

P.S. in my network infrastructure, I'm running Segment Routing where I have 4 routers where the traffic flow might pass one router multiple times depends on the Segment Routing Explicit Path.

1 Answer 1

3

Depending on your Cacti version, we collect errors and discarded packets without any problems on Version 1.1.38.

Here's how we do it.

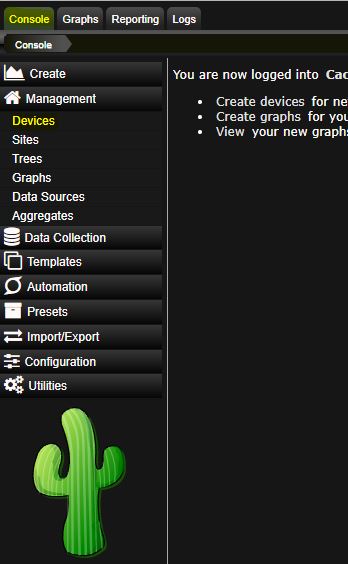
Select the tab Console, then extend Management and click devices.

enter image description here

In the device list, select the switch/router you want to get the information from.

enter image description here

Now under the selected device, click create graph for the device.

enter image description here

Now at bottom select the In/Out Errors/Discarded Packets in the roll-down menu, then select the interface, where you want to create the counter on. The click create.

enter image description here

That's basically how you do it. I assume you have added the device correctly to Cacti and setup SNMP correctly. Otherwise this wont work.

Please note that Cacti takes a bit of time before generating the graph. Several tests should give you data within a short time.

8
  • thanks! I added the In/Out Errors/Discarded Packets to the graphs' tree. However, so far there is no data which is collected, it is always 0, and I can see from Iperf that there is packets loss, although there are data and graphs for the In/Out Bits graphs. Is there any configuration must be done on the routers to catch Errors/Discarded Packets ? Commented Jun 26, 2019 at 13:17
  • @KhalilMebarkia, are you sure that there is congestion enough to drop packets? It may be that there is no packet loss.
    – Ron Maupin
    Commented Jun 26, 2019 at 13:30
  • @RonMaupin This one of Server report: [ 5] 0.0-1921.3 sec 47.6 MBytes 208 Kbits/sec 0.357 ms 81/34015 (0.24%) [ 3] local 172.2.1.10 port 5001 connected with 172.0.1.11 port 34450 I think value 81 is the number of lost datagrams, and 34015 is the number of datagrams which are sent. My links are set to 200Mbps bandwidth in the configuration and I sent 40Mpbs traffic in an infinite loop for 20mins using Iperf. Commented Jun 26, 2019 at 13:38
  • @KhalilMebarkia, you really need to eidt your question to include the router configuration. Also, clear the counters o the router, run your test, and give use the statistics directly from the router CLI, too. You need to compare what Cacti is telling you with what the router itself says to see if there really is a problem.
    – Ron Maupin
    Commented Jun 26, 2019 at 13:42
  • @RonMaupin Thanks, I will redo the test and edit my questions. One question please, the statistics from CLI can be shown using this CLI: show interfaces interface_name and check the input errors and output errors fields, right? Commented Jun 26, 2019 at 14:11

Your Answer

By clicking “Post Your Answer”, you agree to our terms of service and acknowledge you have read our privacy policy.

Not the answer you're looking for? Browse other questions tagged or ask your own question.