6

enter image description here

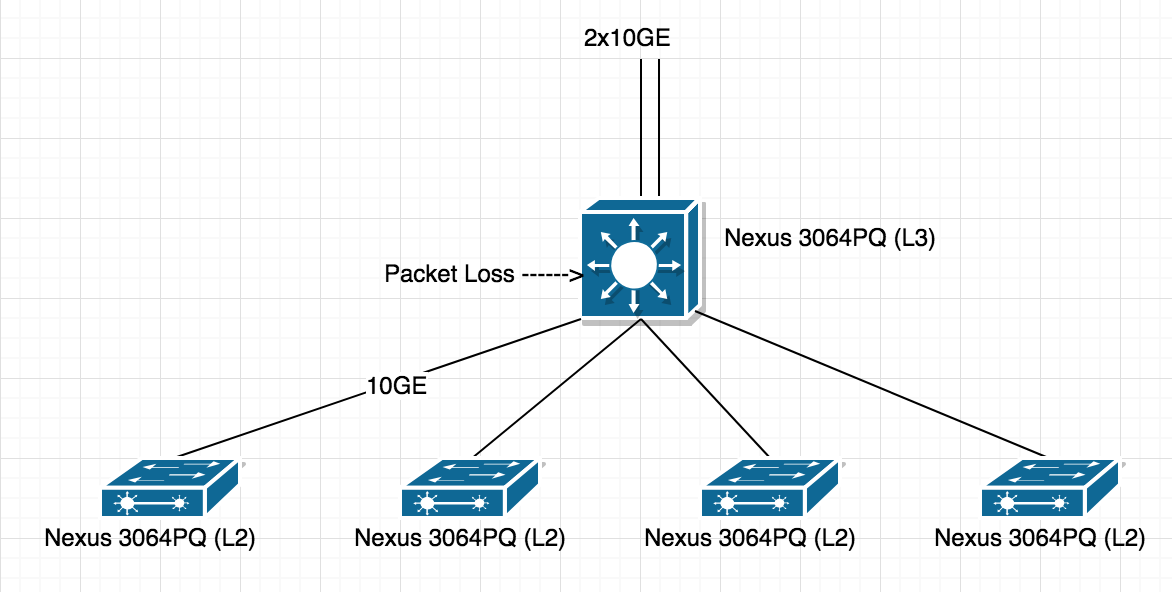
Nexus 3064 CPU spike and packetloss I have L3 Cisco 3064PQ switch which is running latest "nxos.7.0.3.I4.7.bin" basically I am using for routing so my ISP 2x10Gbps link terminated (with LACP) on single switch (without STP,vPC) it and currently live traffic is 10Gbps on switch but i have notice periodic packetloss and not sure where its coming from, after digging i found when my CPU spike up to 70% i have seeing packet loss.

If you notice in below picture that 60% spike and at same time i have noticed 1 ping packet loss. How do i debug this issue and find out what is that pike for and why its happening periodically

    111113641111 11 111 11 11 1  11   1   1 11  1 11     11 12
    011245362136900971084282051974067736846931972921847680082588
100
 90
 80
 70
 60       #
 50       ##
 40      ###
 30      ###                                                 #
 20      ###   #    #                     #                  #
 10 ##################################### ########### ##########
    0....5....1....1....2....2....3....3....4....4....5....5....
              0    5    0    5    0    5    0    5    0    5

               CPU% per second (last 60 seconds)
                      # = average CPU%


    655647776676716562796267574676486635666266736656375765565666
    389694233637271934049753800212280577262865100886229818827948
100
 90                    *           *
 80                    *           *                   *
 70    * *** ****     *** ** *  *  * *   *  ***  * * * *     * *
 60 **** ******** *** *** **** *** *** **** *** **** ***********
 50 ************* *** *** **** *** *** **** *** **** ***********
 40 ************* *** *** ***************** *** **** ***********
 30 ************* *** ******************************************
 20 ***#**###**##******#***#*#*#***#******#**#**#****#**********
 10 ############################################################
    0....5....1....1....2....2....3....3....4....4....5....5....
              0    5    0    5    0    5    0    5    0    5

               CPU% per minute (last 60 minutes)
              * = maximum CPU%   # = average CPU%

UPDATE

In following sample you can see 50% spike t2usd eating more cpus

  • Notes: I am seeing CPU spike every 1 minute and 30second, and its very accurate i did stop-watch test and spiking coming every 1.30second and same time ping drop.

    # show processes cpu sort | ex 0.00

    PID    Runtime(ms)  Invoked   uSecs  1Sec    Process
    -----  -----------  --------  -----  ------  -----------
    12624    641746706  456010193   1407   7.00%  t2usd
       27   1262455737  1006811706   1253   4.00%  ksmd
    11145    288596961  111352447   2591   2.00%  pfmclnt
    11367          113       253    448   1.00%  arp
    11402          200       349    575   1.00%  netstack
    CPU util  :   51.33% user,    9.62% kernel,   39.03% idle
    Please note that only processes from the requested vdc are shown above
    

second spike

 # show processes cpu sort | ex 0.00

   PID    Runtime(ms)  Invoked   uSecs  1Sec    Process
-----  -----------  --------  -----  ------  -----------
12624    641774351  456031502   1407  26.50%  t2usd
   27   1262516503  1006859899   1253   8.00%  ksmd
11367          113       253    448   2.00%  arp
11371          149       106   1406   2.00%  pktmgr
12764      5010346  18794402    266   2.00%  ipfib
11356           79        43   1838   1.00%  adjmgr
11402          200       349    575   1.00%  netstack
12261          116        65   1799   1.00%  rpm
12271      3321325  27299929    121   1.00%  ipfib
12334     23532716  29888867    787   1.00%  l2fm
CPU util  :   57.83% user,    5.40% kernel,   36.75% idle
Please note that only processes from the requested vdc are shown above

UPDATE 2

Does this related to CoPP, Default its enabled on Nexus switches https://supportforums.cisco.com/t5/data-center-documents/packet-loss-when-pinging-from-to-a-nexus-7000/ta-p/3110226

It shouldn't impact forwarding traffic right?

1
  • Comments are not for extended discussion; this conversation has been moved to chat.
    – Ron Maupin
    Commented Jan 5, 2021 at 2:08

1 Answer 1

1

Solution

This is most interesting issue of my life so hold your breath...!

Noticed CoPP Drops in glean & arp

# show policy-map interface control-plane
...
...
class-map copp-s-glean (match-any)
      police pps 500
        OutPackets    3371
        DropPackets   19911477

Look like arp related issue sh ip arp showing every ~85 second my arp table getting flushed so something is not OK here... what is triggering arp-flood?

Lets investigate in STP because because that could be the problem of arp, Hmm based on following output something changed at e1/36

SW1# show spanning-tree detail | inc ieee|occurr|from
  Number of topology changes 4 last change occurred 3287:50:33 ago
          from port-channel1
  Number of topology changes 139 last change occurred 141:18:14 ago
          from Ethernet1/47
  Number of topology changes 139 last change occurred 309:32:43 ago
          from Ethernet1/47
  Number of topology changes 5867 last change occurred 260:38:12 ago
          from Ethernet1/47
  Number of topology changes 154 last change occurred 309:32:42 ago
          from Ethernet1/47
  Number of topology changes 118639 last change occurred 0:01:06 ago
          from Ethernet1/36
  Number of topology changes 124315 last change occurred 0:01:06 ago
          from Ethernet1/36

On port e1/36 one more nexus switch is connected so lets see, hmm something just changed at e1/24

SW2# show spanning-tree detail | inc ieee|occurr|from
  Number of topology changes 5744 last change occurred 260:40:25 ago
          from Ethernet1/1
  Number of topology changes 221898 last change occurred 0:00:38 ago
          from Ethernet1/24
  Number of topology changes 221905 last change occurred 0:00:38 ago
          from Ethernet1/24
  Number of topology changes 49 last change occurred 309:34:56 ago
          from Ethernet1/1

After shutdown port e1/24 problem resolved :) No CPU spike and no packet drop.

I have open ticket to find out what device connected to e1/24 ( i believe its server but lets see)

4
  • Flushing the table in the event of a TCN being received is both expected behavior and is likely the cause of your issue. That said, a TCN generally results from something else running spanning tree and asserting a better root priority. There's usually no good reason for a server to be participating in STP and, as such, it's generally considered best-practice to run BPDU guard on server-facing ports to trigger a warning/shutdown before this conditions can occur.
    – rnxrx
    Commented May 28, 2018 at 21:40
  • I had portfast on all my edge and bpdu guard always enabled when you have portfast, so question is why I'm getting stp convergence on that server nic. I believe VMware or some kind of other application running on that server I will find out and post here soon
    – Satish
    Commented May 28, 2018 at 22:10
  • 1
    BPDU guard is not always enabled when portfast is enabled. You must specifically enable it. You can globally enable both portfast and bpduguard, and it will only be applied to access interfaces, unless you use the trunk keyword, but you must enable both to have both. You should also change the VLAN priorities to make sure that you have the root where you want the root.
    – Ron Maupin
    Commented May 29, 2018 at 0:50
  • Totally concur w/Ron - setting the STP priorities to assure your switches will, in practice, prevent a lot of the standard problems with misconfigured downstream switches. I'd also add that in this case portfast can actually make things worse without BPDU guard specifically enabled, if there's a risk of devices outside your control running STP (as you've now witnessed).
    – rnxrx
    Commented May 29, 2018 at 1:17

Your Answer

By clicking “Post Your Answer”, you agree to our terms of service and acknowledge you have read our privacy policy.

Not the answer you're looking for? Browse other questions tagged or ask your own question.