First of all, I am fairly new to TCP, sorry if I miss anything obvious. Also, any suggestion to help me investigate are welcome.
from my understanding, if I have a setup:
SENDER------SWITCH------RECEIVER
        A           B
if both link A & B have 0% loss rate & 100Mbps bandwidth but:
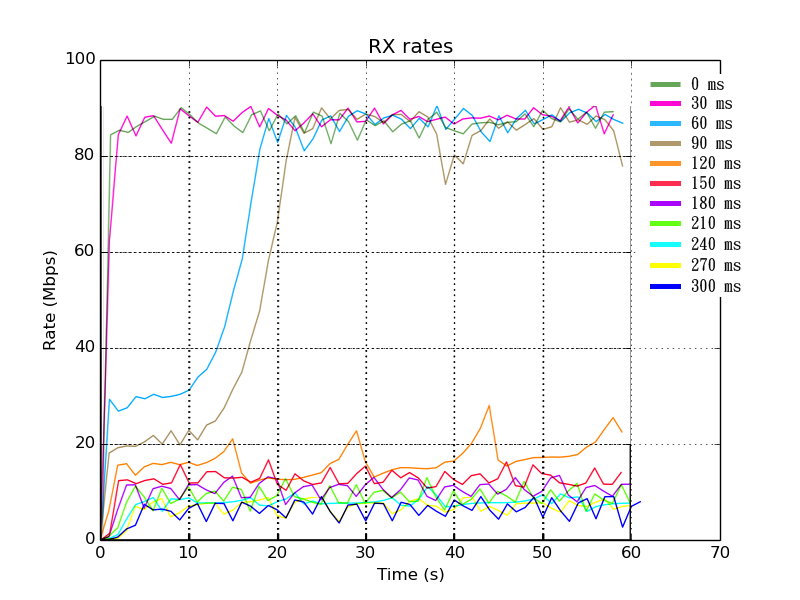
scenario 1) A has 1~301ms delay and B has 1ms

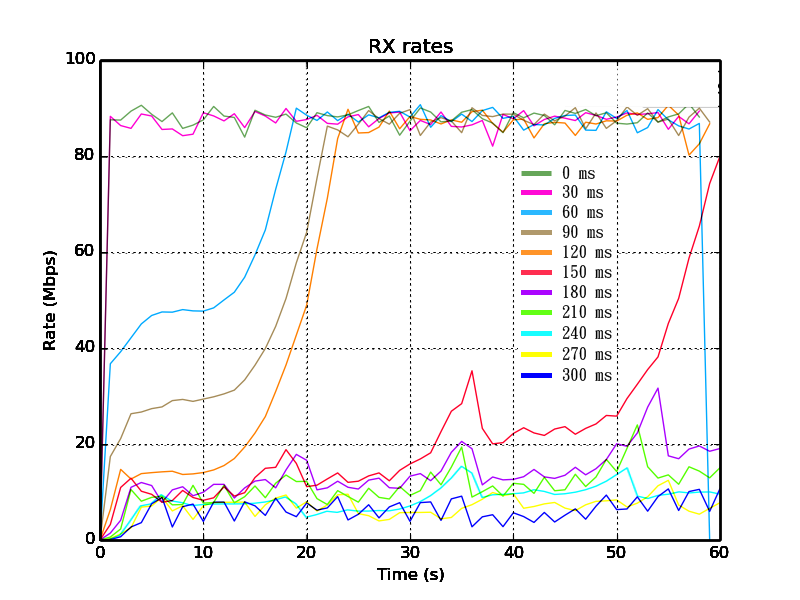
scenario 2) A has 1~151ms delay and B has 1~151ms

since the total delay of the network should be the same in both scenarios, shouldn't the graph of throughput against time on sender side looks exactly the same?
take the 60ms line in both graphs for example. Although the total delay in scenario 2 is still 60ms in the network, it never encounters another congestion event between around second 1 and until it hits bandwidth cap, not like scenario 1 which had many.
the two major concern are:
- why does the shape of low latency line during the early stage be different?
- why do some previously unable-to-reach-cap cases could now reach the cap?
some background info that might/might not help:
- I used mininet(virtual network with ubuntu) for the test setup.
- linux, so TCP CUBIC for congestion avoidance algo.
- the iperf command used
recvr.cmd('iperf -s -p', port, '> %s/iperf_server.txt' % args.dir, '&')
sender.sendCmd('iperf -c %s -p %s -t %d -i 1 -yc > %s/iperf_%s.txt' % (recvr.IP(), port, seconds, args.dir, 'h1'))
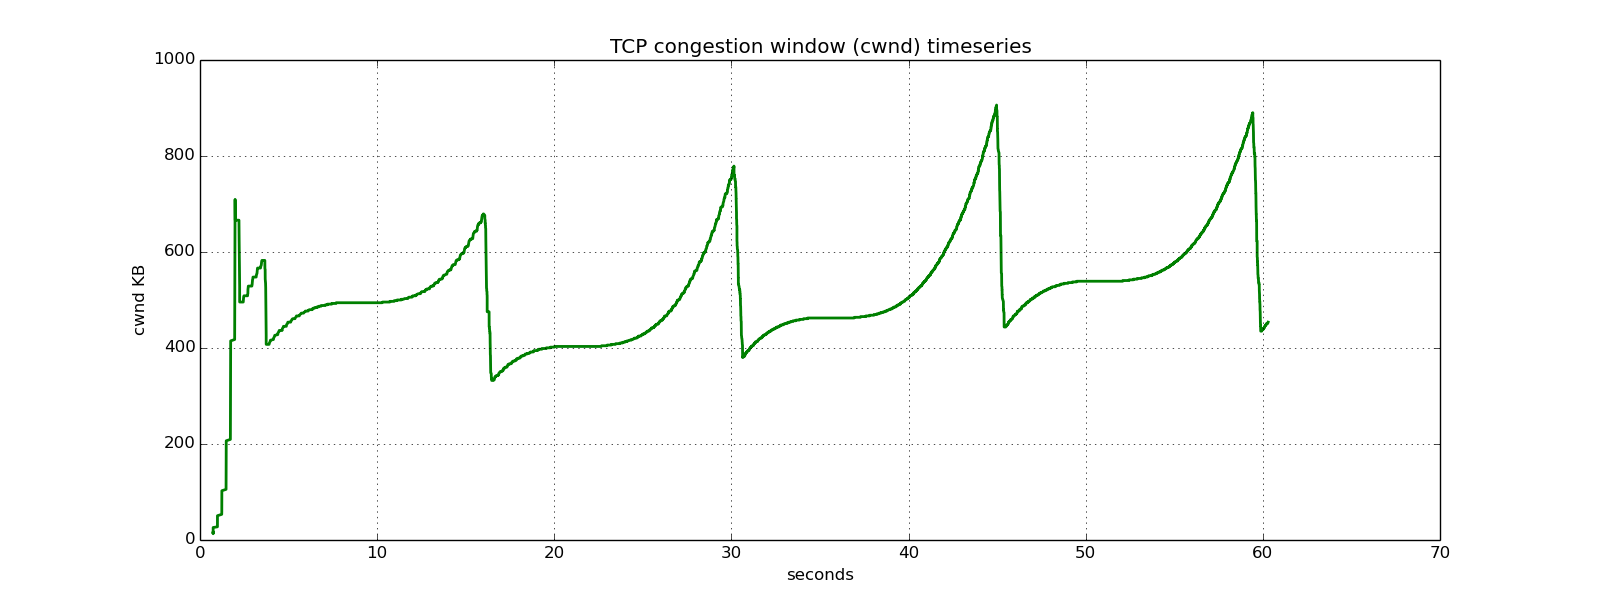
- cwnd for link A 121ms delay, link B 1ms (scenario 1, 120ms line)

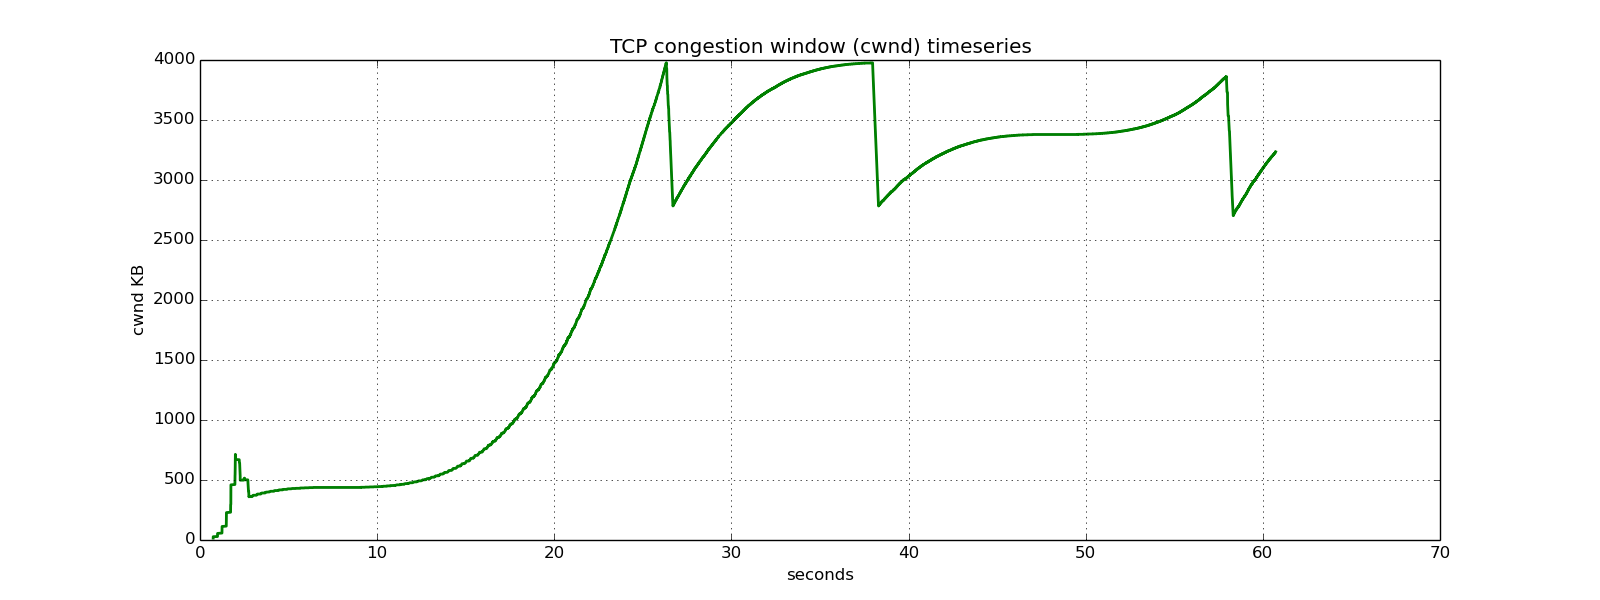
- cwnd for link A 61ms delay, link B 61ms (scenario 2, 120ms line)

